
Manual data entry between two official tools is a cost you can compute from payroll, from the hours spent unwinding a bad record, and from the book of work you cannot take because coordinators are already full. That cost stays on the books for as long as people re-type the same fields, which is why the problem outlasts whatever tool is fashionable this quarter.
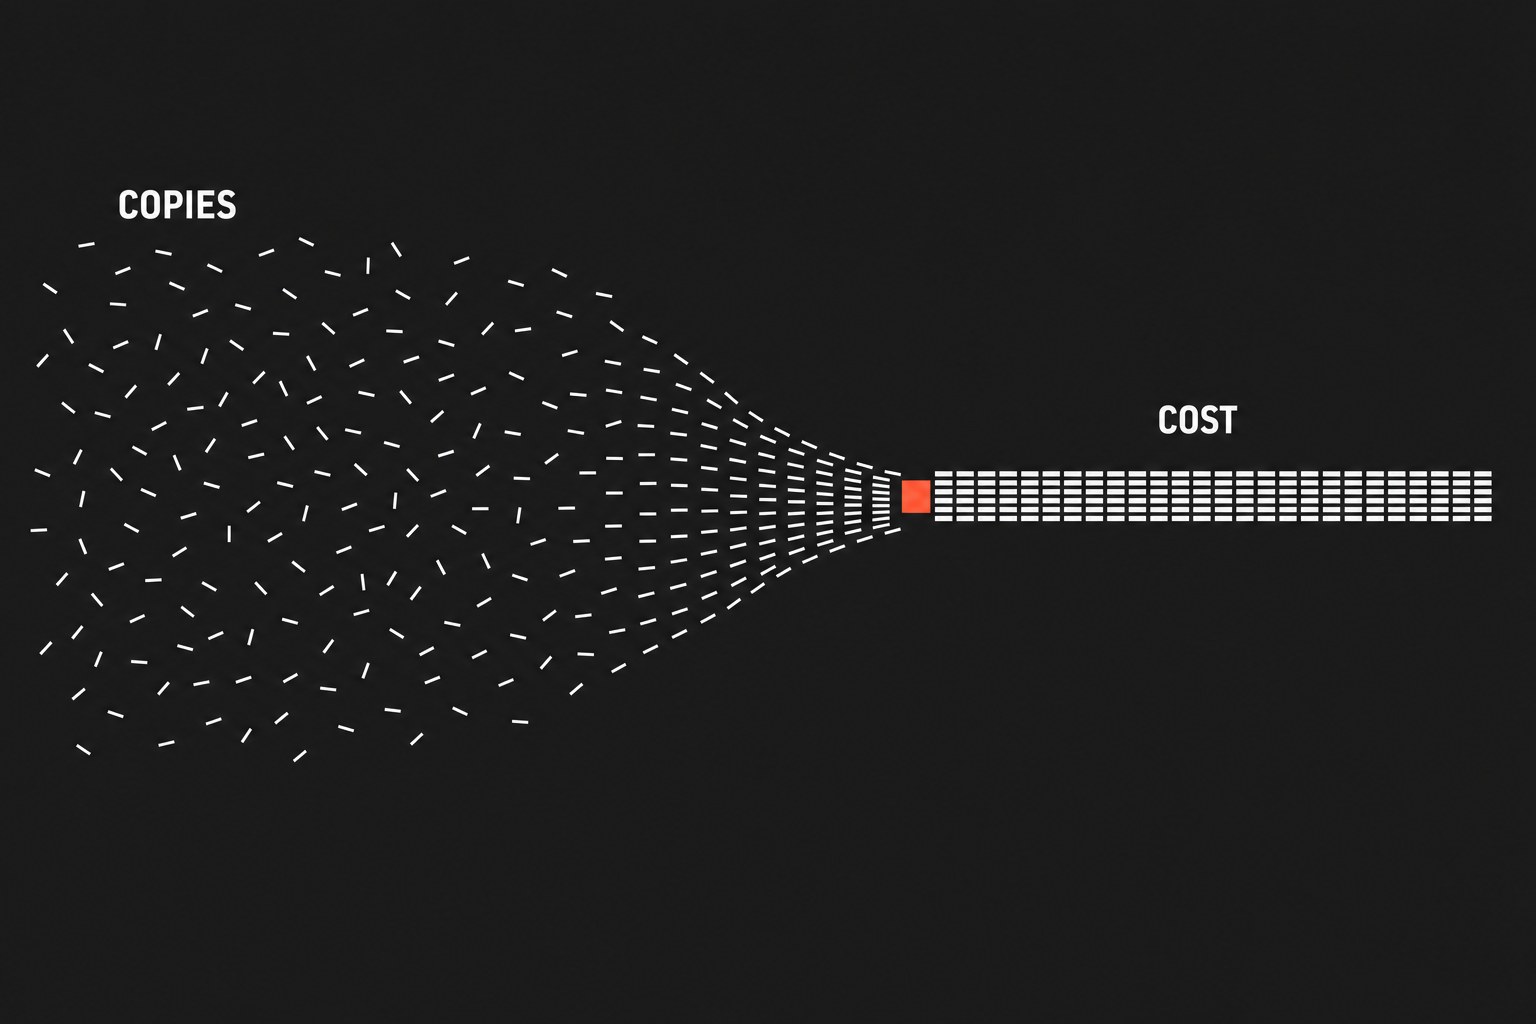
Most firms never price it because the work hides inside client communication and getting the week out. The method below names three formulas, shows a worksheet you fill with your own numbers, and tells you when the audit is not worth a week of attention.
Three layers, one tax
What you take to finance is the split:
- Direct labor: hours spent copying intake, cleaning a shared sheet, or reformatting a report so finance can post it
- Repair: senior time that follows a wrong billing code, a mis-assigned milestone, or an invoice that has to go out again
- Capacity loss: the coordinator who spends a slice of every week on swivel-chair entry and cannot take another account without you opening a req
Skip a layer you cannot tally in a week, but keep the split. A vendor "hours wasted" percentage is not yours, and it does not belong on a budget slide with your logo on it.
Why a timesheet will not give you the number
Ask the team how much they copy and paste and you will get a feeling, because people file the work under communication, cleanup, or just finishing the file. Three fields across two tabs can take less than a minute; thirty times a day across a few people, that is real hours nobody logs, so the interview produces a shrug.
"Fridays are busy" also has no transaction count. It does not tell you how many times work left one person or system so another could continue (a handoff), how many of those needed cleanup, or which two systems created the miss. Without that count you cannot fill the error-repair formula later.
The formula stack
Name the results so a finance partner can audit the factors, leave any factor blank until you have a count, and do not import a percentage to make the sheet look finished.
Payroll: annual direct cost
Annual Direct Cost
Hours Per Week Per Person comes from a tally, not a hallway estimate, and the fully loaded rate is the burdened wage finance already uses for that seat.
Repair: annual error cost
Direct payroll is rarely the line that gets a partner's attention, because the expensive part is the miss that someone else has to unwind.
Annual Error Cost
Transactions come from the five-day count scaled to a year, or from a quarter of invoices and tickets you can actually pull. Error Rate is first-pass failures on that path, and Hours To Unwind should include the project manager, finance, and whoever explains the delay, so the blended rate reflects that mix rather than only the coordinator's wage.
If you have no error rate from the last quarter, leave the line blank until the tally. A made-up industry percentage makes the spreadsheet look done and makes the decision worse.
Lost capacity: hours you cannot sell or staff
Hours Locked In Entry
If the locked hours approach another full-time year for the same seat, or if dates already slip when the bridge is dirty, the tax is high enough to act on one pathway. Do not convert this layer into revenue unlocked unless unused work is waiting on that seat; the honest version is headcount you avoid or slip you stop paying for.
A worksheet with placeholder numbers
The figures below are labels, not a case study: replace every factor with your count, and leave a product blank if the audit has not filled that factor yet.
Illustrative worksheet only:
- People On The Path: 4 coordinators
- Hours Per Week Per Person: 6
- Fully Loaded Hourly Rate: $35
- Annual Manual Transactions: 5,000
- Error Rate: 4%
- Hours To Unwind: 1.5
- Blended Hourly Rate: $50
Annual Direct Cost
Annual Error Cost
Hours Locked In Entry
When not to bother measuring
A five-day audit costs attention, so skip it when the answer cannot change what you do next:
- One person runs the path a few times a month and a miss is cheap to reverse. The stack will spit out a small number you already knew.
- The source or destination system is being retired in the same quarter. You would be measuring a bridge you have already decided to abandon.
- The bottleneck is judgment rather than transcription. If the delay is a senior person deciding a scope change or reviewing a deliverable, a field-transfer log will not tell you anything you can automate.
- You already have a working, validated handoff and someone wants a percentage for a slide. Measurement that cannot change the pathway is theater.
If none of those apply, and the same two systems still meet in a spreadsheet every week, run the count.
A five-day handoff audit
Pick one path, such as onboarding, monthly billing, or dispatch, and for five business days log every completed handoff rather than a Friday estimate of how the week felt. Record the source and destination systems, the fields moved by hand, elapsed minutes, and whether the record passed on the first try or needed a cross-check.
That log is the ledger: a coordinator who feels buried becomes a count of transfers, minutes, and retries, which is what the three formulas consume. One pathway is enough to fill the factors and decide whether the bridge is worth replacing.
What you do with the number
The point of the stack is to pick a handoff rather than argue about whether people are busy. Once you have a dollar figure and a retry count, replace that bridge with a workflow that validates the payload and alerts when it fails. An integration that dies without a ping puts the tax back on the coordinator, who will open the two tabs again and copy the row by hand. Four weeks is enough if you stay on one path: write the field list, run the tally, price the year, then implement the handoff so it does not depend on copy-paste.
Next step
If the week still depends on re-keying, spreadsheet bridges, or integrations that fail without a ping, start with one pathway and a number. That tally is the first pass Flaux runs in a workflow-automation engagement.